Know the charging demand before you build.
Drop a pin on any location and see how many fast-charging sessions and kWh it can expect each month, and what drives the number.
- 10,000+
- measured sites behind every forecast
- 40+
- data points gathered for every site
- 100
- sites scored in one go
4 of 5
fast-charging sites underperform.
Once the charger is in the ground, the location can’t be changed.
Read the analysisOnly one hits its benchmark
How sites are chosen today
Most charging sites are still picked by gut feeling.
Location decides how busy a site gets. Yet the process behind most site decisions is manual, unstructured and built on incomplete data.
Pull traffic counts
From whichever source covers the road
Visit the site
Look at what is around it
Build a spreadsheet
Copied and adjusted by hand
Make the call
On local knowledge and gut feeling
Repeated by hand for every candidate, it takes weeks per site, and there is no common yardstick to compare one site with the next.
With pickel
Choose your next site on data, in seconds.
pickel replaces the guesswork with a forecast learned from fast-charging sites that are already running.
Drop a pin
Or paste a whole list
Get sessions and kWh
Expected per month or per year
See what drives it
Each local factor as a plus or a minus
Compare side by side
Against each other and the typical site
Instead of gut feeling
See why a site scores the way it does.
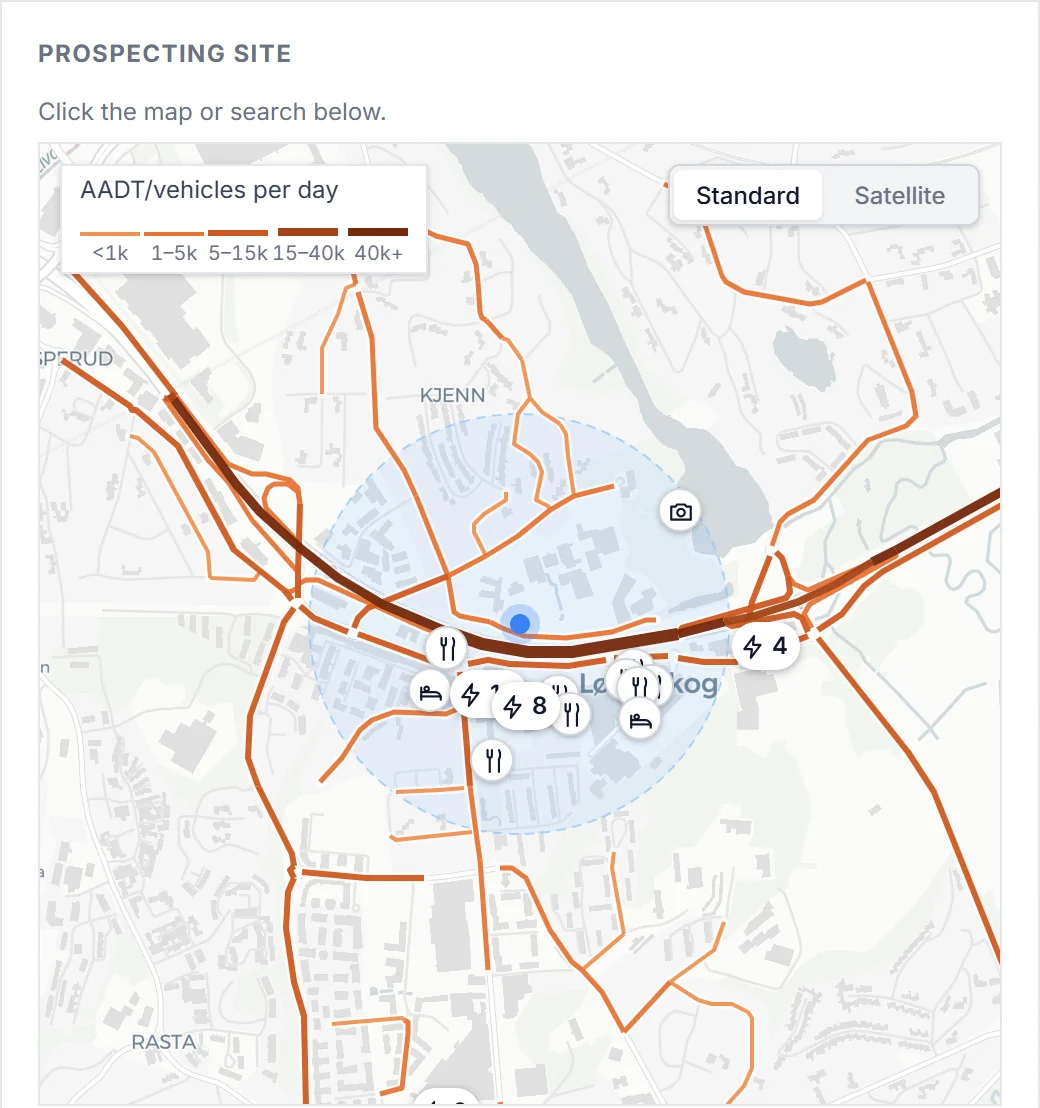
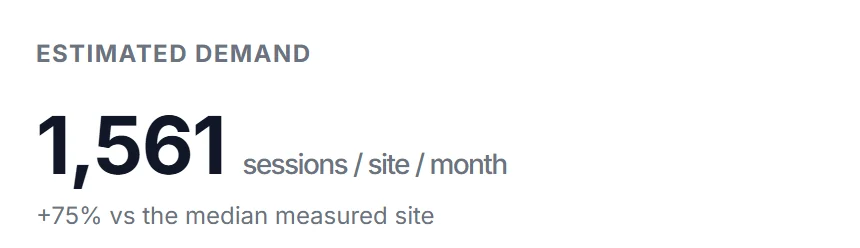
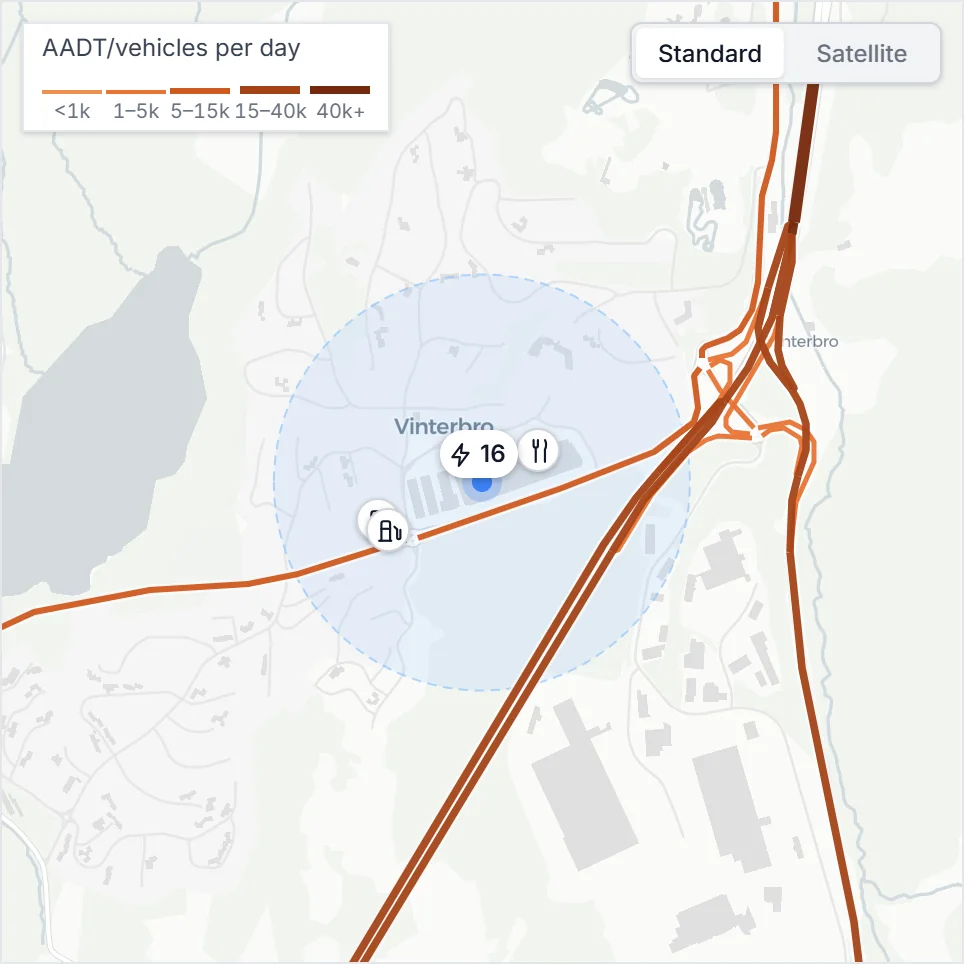
The forecast starts from a typical site and shows what each local factor adds or takes away, so you can defend the number in an investment meeting. Pick an example site near Oslo and watch its forecast build.
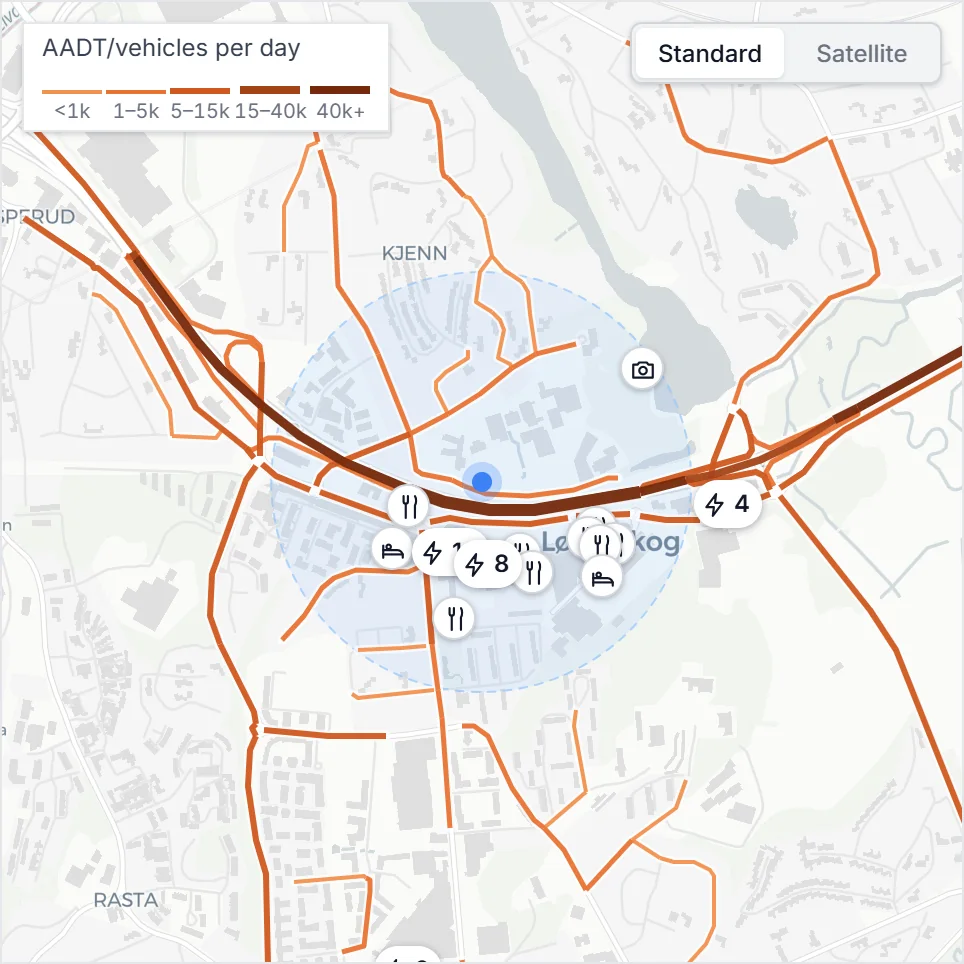
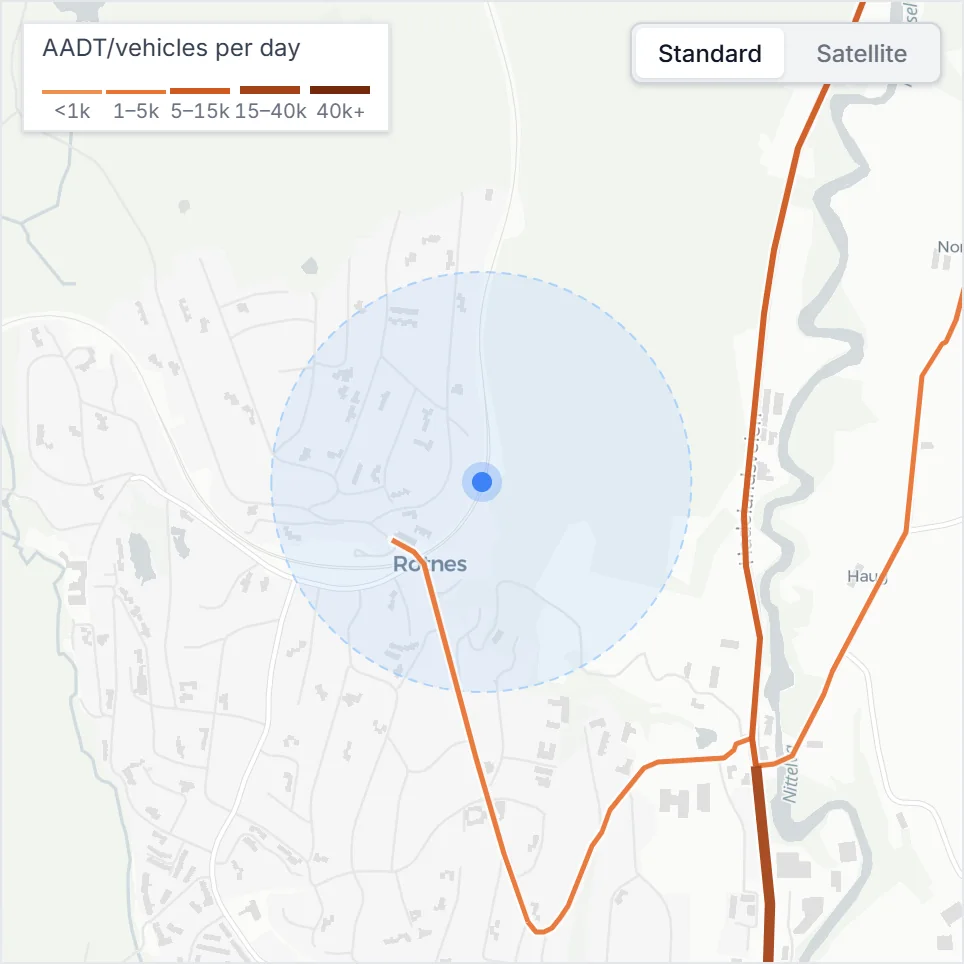
Estimated demand · Lørenskog
0sessions / month
+108% vs a typical site
- Typical site752
- Charger power+60
- EV share in the municipality+23
- Demand at nearby chargers (5 km)+2
- Traffic on the busiest road nearby+276
- Competing chargers (500 m)+67
- Fuel stations (500 m)±0
- Hotels (500 m)+67
- Restaurants (500 m)+237
- Tourist attractions (500 m)+76
- Forecast1,561
Traffic on the busiest road nearby: 51,615 cars/day here vs 10,395 at the typical site, +276 sessions a month.
Instead of weeks per site
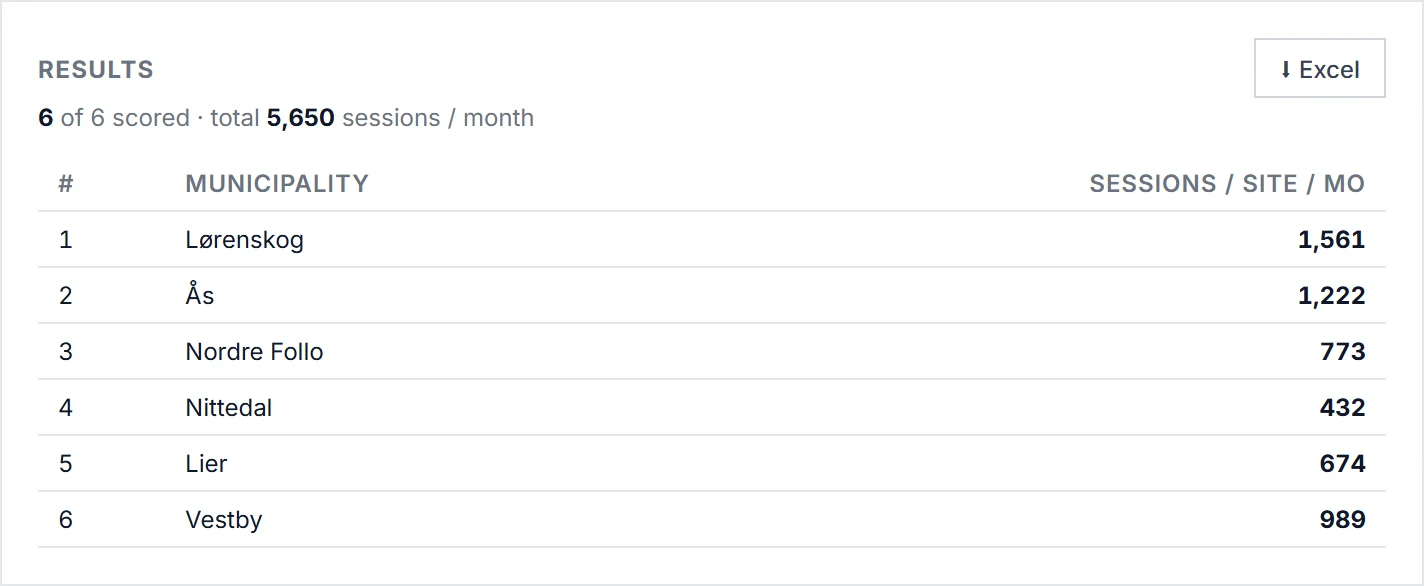
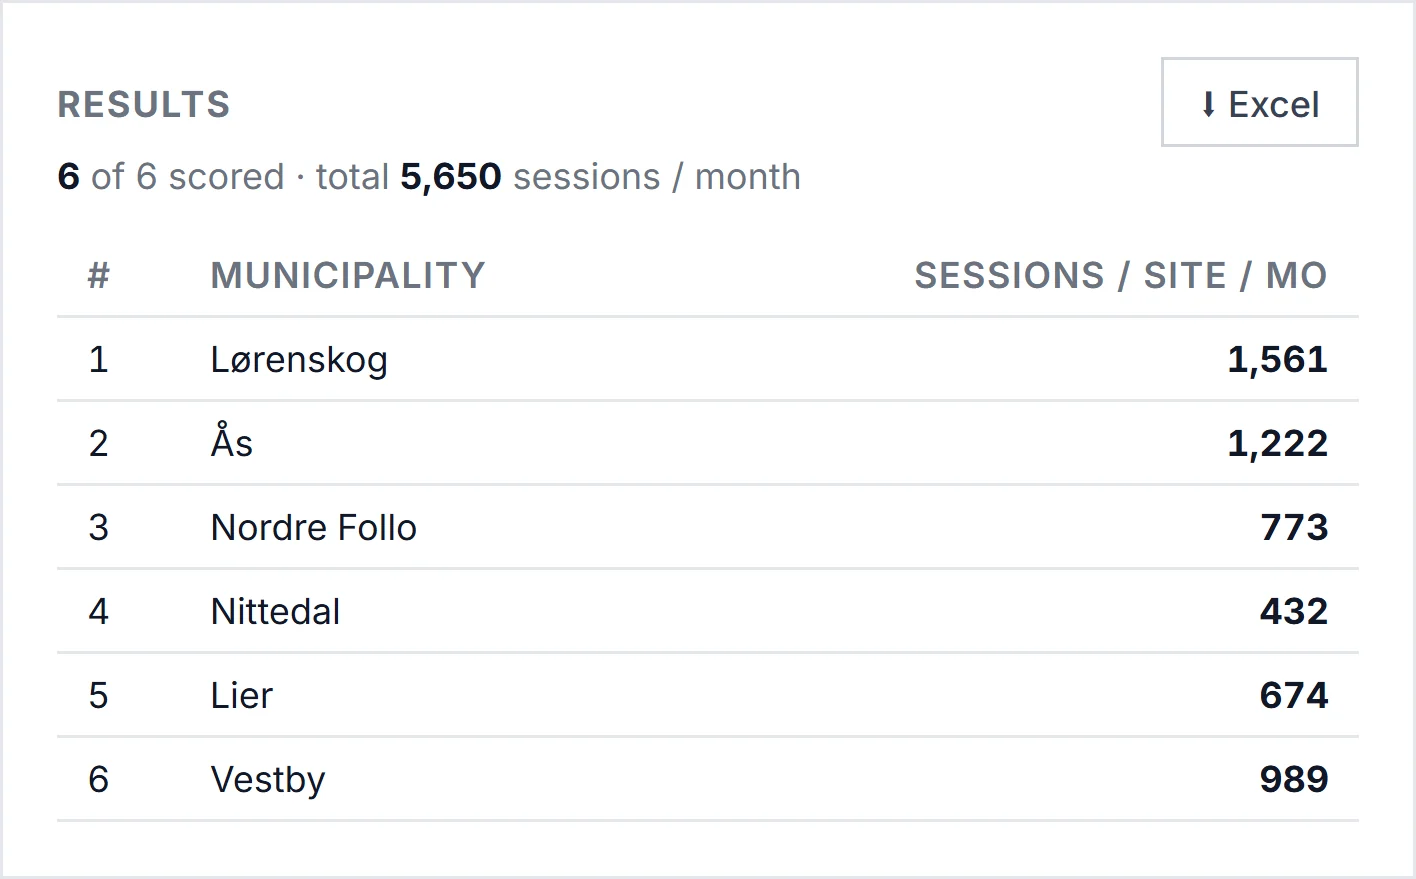
Score a whole list in one go.
Paste up to 100 locations and rank them side by side. Sites that look unlike anything we have measured are marked, so you know where to look twice. Export the results to Excel or PDF for your investment case.
Get started
Make your next
site bankable.
Whether you run chargers, own the land or invest in them, bring a few locations you are considering. We will score them together in a short demo and show you what drives each forecast.